

Weekly Update
June 1, 2026

Upcoming Events
Monday, June 1
GDPNow Update
Tuesday, June 2
Job Openings and Labor Turnover Survey Release
Wednesday, June 3
Beige Book Release
Barr Speaks at Community Development Bankers Association Peer Forum
Friday, June 5
Jobs Report Release
Saturday, June 6
Barr Speaks at the DC Finance Conference
Blackout Period Begins
Recent News
Prices… Inflation declined in April but remained elevated, new data from the Bureau of Economic Analysis. The Personal Consumption Expenditures Price Index (PCEPI) grew at a continuously compounding annualized rate of 4.8 percent in April 2026, down from 8.0 percent in the prior month. It has averaged 4.7 percent annualized growth over the last six months and 3.7 percent over the last year.
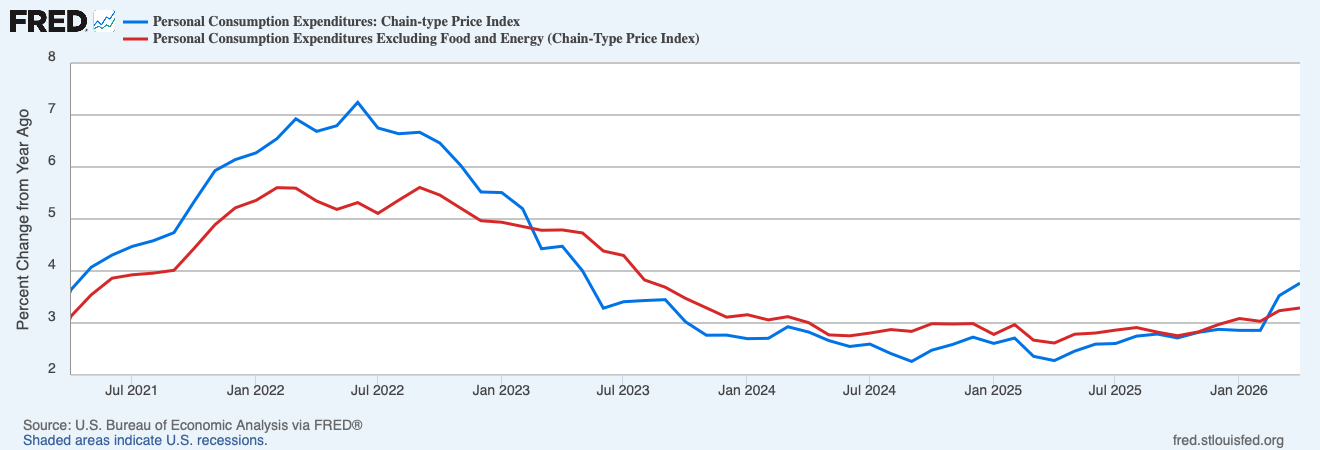
Core inflation, which excludes volatile food and energy prices, also remained elevated. Core PCEPI grew at a continuously compounding annualized rate of 2.9 percent in April 2026, down from 3.5 percent in the prior month. It has averaged 3.7 percent annualized growth over the last six months and 3.2 percent over the last year.
Although much of the recent rise in inflation can be explained by the ongoing conflict in the Middle East, which has pushed up energy prices, excess demand continues to contribute to the longer run inflation problem. Nominal spending has grown at a continuously compounding annualized rate of 5.7 percent over the last year. For comparison, it averaged just 4.1 percent annualized growth over the five years just prior to the pandemic. Absent a change in total factor productivity growth, restoring nominal spending growth to its pre-pandemic rate would reduce the annual rate of inflation by 160 basis points.
Solid growth… Real gross domestic product (GDP) grew at a continuously compounding annualized rate of 1.6 percent in 2026:Q1, according to the second estimate from the Bureau of Economic Analysis released last week. It has grown 2.5 percent over the last year. For comparison, real GDP grew at a continuously compounding annualized rate of 2.5 percent over the five-year period just prior to the pandemic.
The Atlanta Fed currently estimates real GDP will grow at an annualized rate of 3.8 percent in 2026:Q2. In March, the median Federal Open Market Committee (FOMC) member projected 2.4 percent real GDP growth this year.
Waller on inflation expectations… Many FOMC members attribute the persistent above-target inflation over the last year to a series of supply shocks. At a talk in Frankfurt last week, Federal Reserve Governor Christopher Waller pointed to “multiple price shocks, starting with tariffs and followed by the current oil shock.”
The consensus view is that the Fed should look through adverse supply shocks. The change in prices associated with an adverse supply shock reflects a change in relative scarcity, and might thereby encourage people to economize on scarce resources when feasible. Moreover, an adverse supply shock will generally have a temporary effect on the price level, which will return to trend when supply recovers. The proper response, therefore, is thought to be no response at all.
Waller is now questioning that view. He worries consecutive adverse supply shocks may “interact in such a way that longer-term inflation expectations rise and inflation becomes more persistent.”
If people know that each shock in a sequence of price shocks is transitory, then why might they expect average inflation to increase in the future when observing this sequence of shocks? Let me give a simple example. If you flipped a coin and won a dollar each time it came up heads and lost a dollar every time it came up tails, your expected winnings from the next flip of the coin would be zero. This would still be true even if the last three coin flips came up heads. But when forming this expectation, it is assumed that the flips are independent and uncorrelated. And we all make this assumption when calculating this expectation. Expectations formed this way are based on classical probability theory—in this case, people are assumed to know the data generating process.
But what if they don’t understand it? Then they must make a judgment on a probability that may only be based on limited information. This is where Bayesian updating comes into play. In a nutshell, Bayesian updating adjusts the perceived probability of an event happening based on the history of past shocks. To illustrate how this works, if someone saw three heads come up in a row, they might infer that the coin flips are not independent and are, in fact, positively correlated. The source of the positive correlation is unclear, but it is what they believe. So, based on observing three heads in a row, you would put more than a 50 percent probability weight on a coin turning up heads on the next flip and your expected winnings would go up, not stay at zero.
Waller said the “Bayesian view may apply to inflation expectations as well.”
If people do not know the true inflation generating process and see a sequence of positive price shocks, they may infer that the next price shock is more likely to be positive than negative. This view can lead them to raise their inflation expectations even though they may also believe the recent shocks are transitory. A large body of research shows that Bayesian selection sometimes helps explain human behavior, and it may be relevant in judging the chances of a move upward in inflation expectations.
If people update expectations in line with the Bayesian view, policymakers may need to rethink the standard approach to dealing with supply shocks: “it may be easy to look through a single price shock such as tariffs, but it may be more risky to look through a series of positive price shocks,” Waller said.